



Cloud systems rarely fail because teams have no monitoring. More often, teams have too many disconnected signals and too little context.
Dashboards show CPU saturation. Logs generate thousands of events. Alerts arrive from several tools. Yet engineers still spend too long answering what actually changed, which service is affected, and why performance degraded.
Strong cloud observability strategy connects metrics, logs, traces, infrastructure state, deployment context, and ownership so teams can move from detecting an issue to understanding it.
Value comes from faster diagnosis, safer releases, clearer reliability targets, and lower operational noise not from collecting more telemetry.
Cloud monitoring detects known conditions. Observability helps engineers investigate conditions they did not predict in advance.
Difference becomes important in environments built on Kubernetes, managed cloud services, APIs, queues, and microservices. Infrastructure dashboards remain useful, but they rarely explain distributed failures.
Cloud observability should help answer why latency changed, which deployment introduced a regression, which dependency failed, and which users are affected.
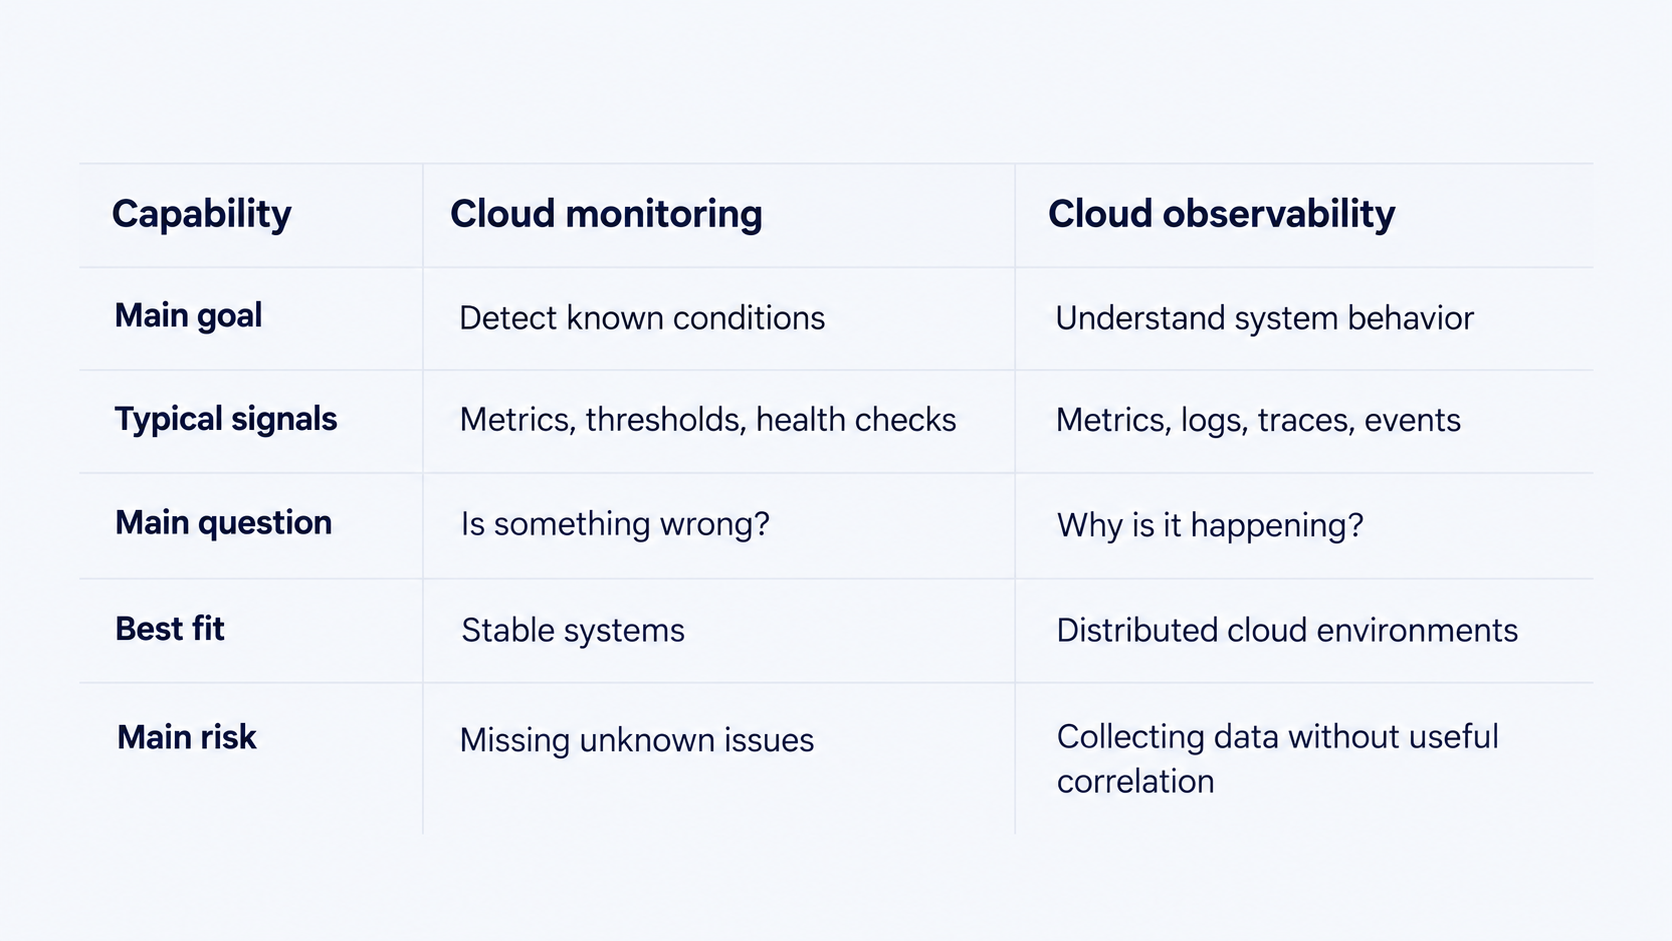
Monitoring remains part of observability. Difference lies in how signals are connected and used during operational decisions.
Observability strategy should start with the questions teams need to answer during incidents, release validation, and capacity planning.
Collecting everything first usually creates noisy alerts and expensive storage. Better approach starts with critical services, user journeys, failure modes, SLOs, and ownership.
For each service, teams should understand:
OpsWorks' DevOps Maturity Model already connects metrics, logs, distributed tracing, SLOs, incident metrics, and capacity visibility with DevOps maturity. Observability works best as an operational capability rather than a separate monitoring project.
Useful observability depends on choosing the right signal for the right question.
Metrics efficiently track behavior over time. Request rate, latency, error rate, saturation, CPU, memory, queue depth, and database connections can reveal whether a service is moving outside expected boundaries.
Strong cloud monitoring avoids treating infrastructure metrics as business impact. High CPU may not matter while throughput and latency remain stable. Lower CPU may still hide a problem when queues grow or an SLO is at risk.
Logs provide detail that aggregated metrics cannot. Structured logs can capture application errors, authentication events, request metadata, release information, and relevant state changes.
Logging every event at maximum verbosity does not improve observability automatically. It increases storage and indexing costs.
Useful logs need consistent fields such as service name, environment, release version, correlation ID, and trace ID.
Distributed tracing becomes critical when requests cross multiple services, queues, APIs, databases, or cloud components.
Trace data shows where latency accumulates, which dependency failed, and how one slow component affects a larger transaction.
Capturing every trace indefinitely is rarely necessary. Sampling should depend on traffic volume, critical workflows, and investigation requirements.
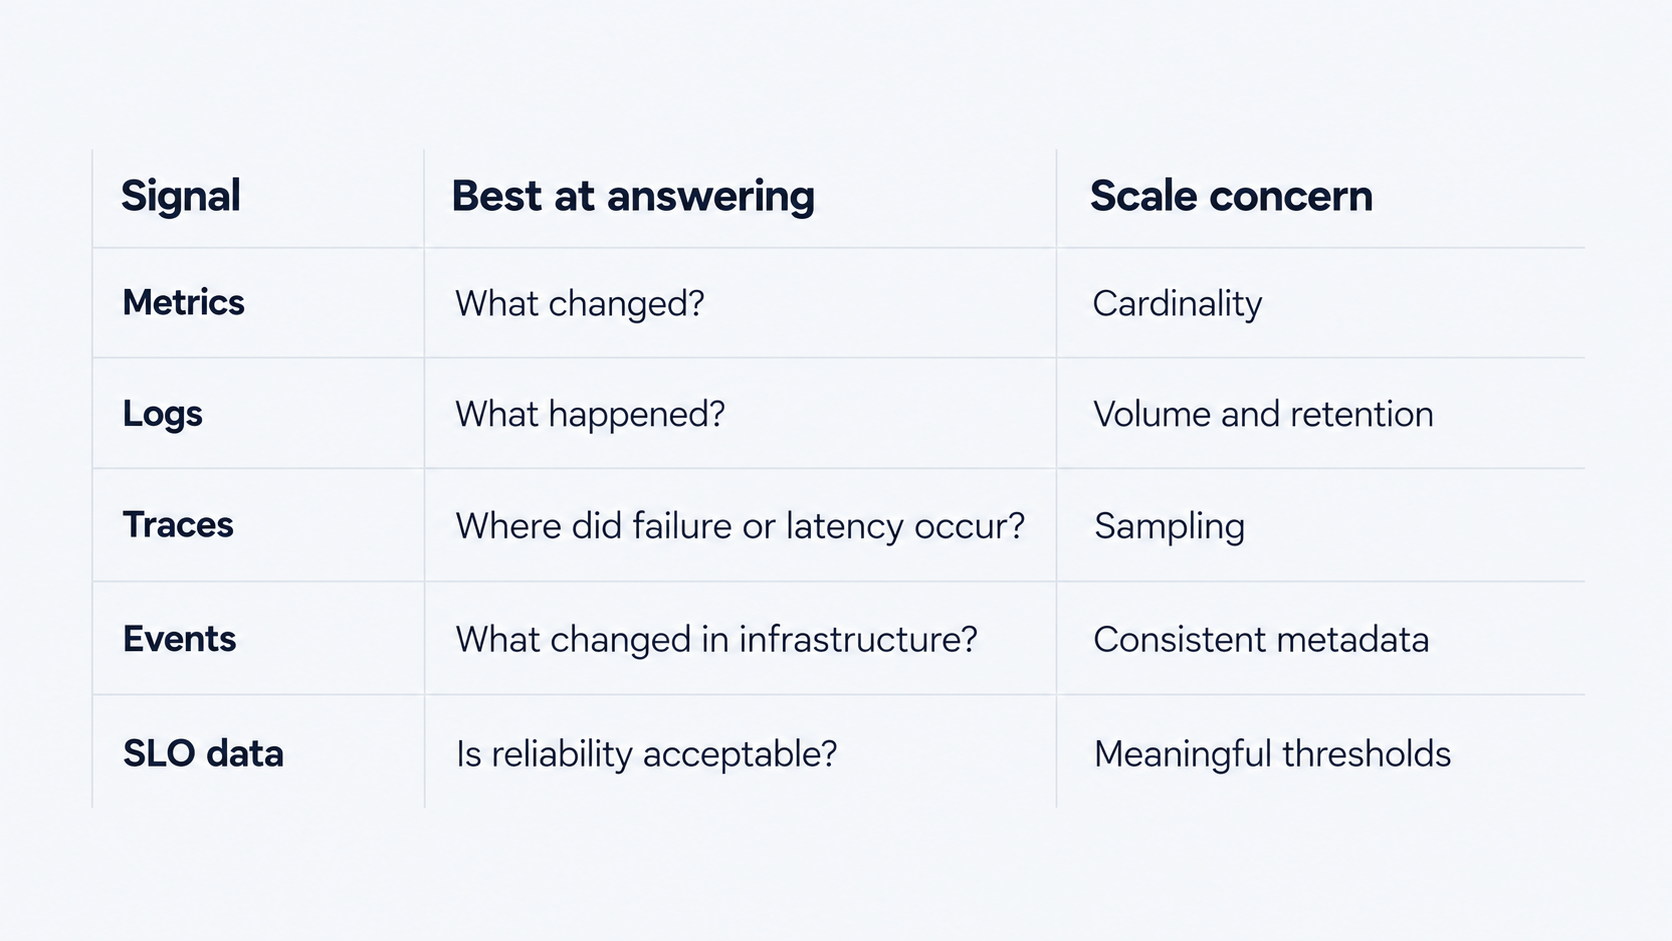
Value appears when metrics, logs and traces can be correlated instead of investigated separately.
Good observability architecture makes telemetry consistent before it reaches dashboards. Applications, infrastructure, Kubernetes, and managed cloud services generate telemetry. Collection layers then enrich, filter, sample, and route that data to observability backends.
Consistent metadata is essential. Service name, environment, cluster, region, application version, deployment ID, and owning team should follow shared conventions. Without that context, metrics, logs, and traces remain separate datasets even when stored in the same platform.
OpenTelemetry can provide a vendor-neutral layer for generating and collecting telemetry. Collector-based architectures can also process, enrich, filter, and route data before it reaches storage. OpenTelemetry does not replace decisions around storage, alerting, retention, dashboards, or incident response. Its main advantage is reducing coupling between application instrumentation and a specific observability vendor.
Kubernetes observability is difficult because infrastructure constantly changes. Pods disappear. Workloads move. Autoscaling changes capacity. Requests travel across services and dependencies. Cluster CPU and memory metrics alone cannot explain this behavior.
Useful Kubernetes observability connects:
Deployment metadata helps engineers identify whether a new container image, configuration change, or scaling event aligns with a regression. Cardinality also needs control.
Pod IDs, user IDs, request IDs, URLs, and other high-variance values can make metrics extremely expensive. Some context belongs in logs or traces rather than metric labels.
OpsWorks' Internal Developer Platform guide shows how Kubernetes, CI/CD, security, and observability can become standardized platform capabilities instead of being rebuilt by every team.
Production incidents frequently follow change. New application version, infrastructure configuration, database setting, or container rollout may appear first as increased latency or error rates.
Observability becomes far more useful when runtime signals can be correlated with deployment history. Release version, commit, environment, deployment timestamp, and owning team should be available during investigation.
OpsWorks' GitOps for Cloud Infrastructure explains how version-controlled desired state and automated reconciliation improve infrastructure delivery. Observability complements that model by showing what happened after a change reached production.
Alert volume is not a measure of operational maturity. Useful alerts should map to customer impact, service objectives, security risk, or imminent resource exhaustion.
SLOs provide a better basis for prioritization than isolated infrastructure thresholds. Error-budget consumption, sustained latency degradation, availability loss, or failure of a critical workflow usually matter more than a single CPU threshold.
Every production alert should answer four questions:
Alert without ownership becomes noise. Alert without context becomes investigation overhead.
Observability spend can grow quickly when every signal is retained at full fidelity. Main cost drivers include high-cardinality metrics, verbose logs, trace ingestion, indexing, long retention, and duplicated telemetry.
Strong observability best practices include:
OpsWorks' Cloud Cost Optimization Strategies explains the broader relationship between architecture, workload efficiency, monitoring, and cloud spend. Same principle applies here: every telemetry stream should have a purpose, retention policy, and owner.
Cloud observability tools should support the operating model rather than dictate it.
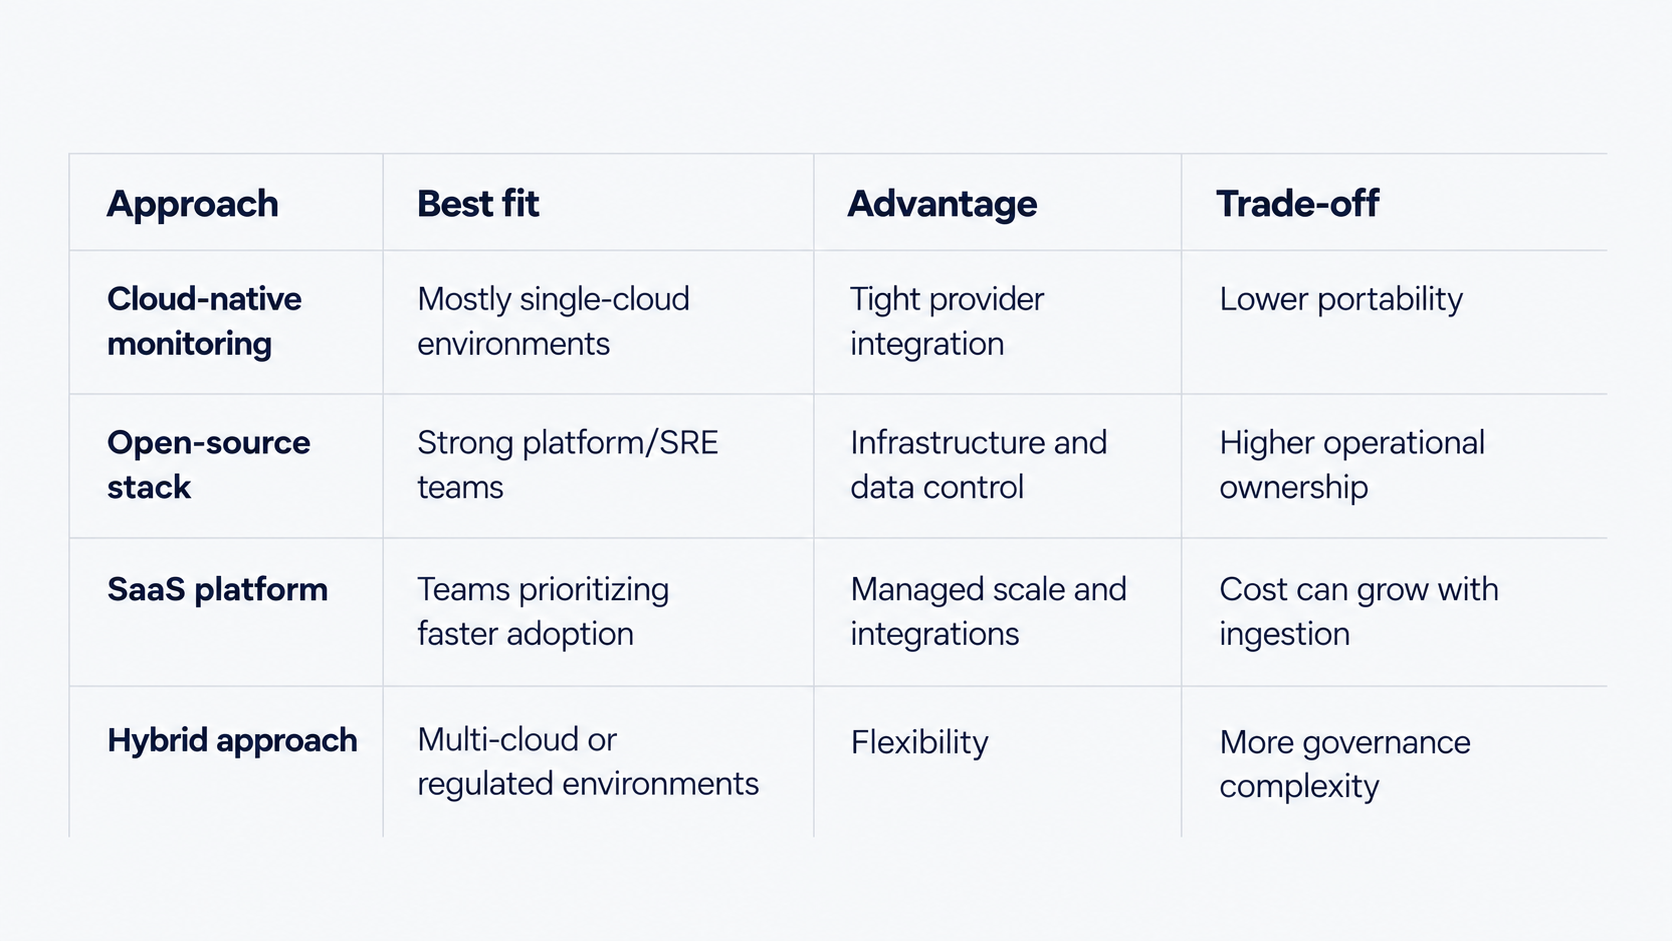
Tool selection should focus on operational outcomes. Can teams correlate signals across services? Can developers instrument new workloads consistently? Can telemetry volume be controlled? Can retention and access policies be enforced? Feature count matters less than how well the platform fits the architecture.
Not every organization needs the same observability investment.
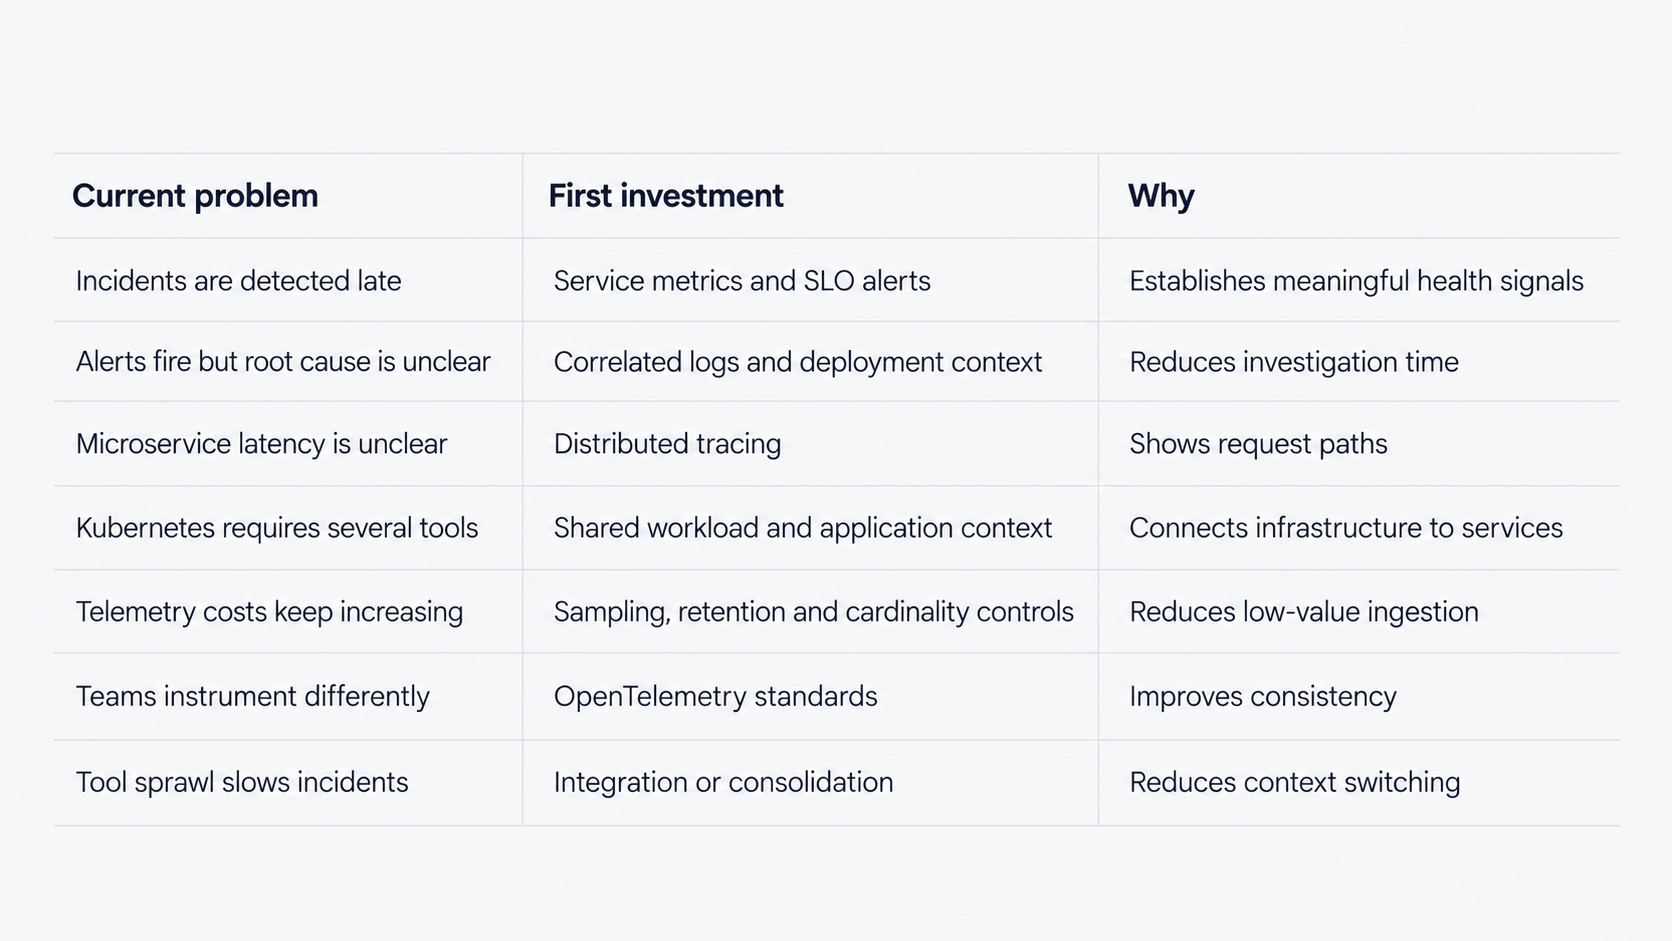
Teams without reliable monitoring or clear service ownership should not start with advanced tracing. Mature distributed environments may gain more from correlation and standardization than from adding another dashboard.
Large observability migrations often fail when teams try to instrument every workload and replace every tool at once.
Practical implementation can follow five stages:
Progress should be measured through outcomes such as detection time, diagnosis time, alert quality, SLO performance, telemetry cost, and coverage of critical services.
Observability projects often start as tooling decisions and quickly become architecture and operating-model projects.
OpsWorks supports cloud environments where monitoring, application performance, infrastructure operations, and reliability need to improve as part of broader DevOps transformation.
DevOps Transformation services include application performance monitoring, architecture review, performance optimization, CI/CD implementation, infrastructure automation, scalability, and operational improvements.
Existing tools do not always need replacement. Better results may come from improving instrumentation, metadata, log aggregation, metrics, alert logic, retention, ownership, and integrations around systems already in place.
External DevOps expertise becomes particularly useful when Kubernetes or microservices increase complexity, monitoring tools produce fragmented data, telemetry costs grow without clear value, or teams need consistent observability across multiple environments.
Cloud observability succeeds when engineers can move from a production symptom to an actionable explanation quickly. More metrics do not guarantee that. More logs do not guarantee that. More dashboards do not guarantee that.
Strong cloud observability strategy gives every signal a purpose and connects telemetry with service context. Metrics reveal change. Logs preserve detail. Distributed tracing follows behavior across service boundaries. SLOs establish priority. Cost controls keep telemetry sustainable.
When monitoring, logging, and tracing operate as one capability, observability at scale becomes part of how cloud systems are built, released, and operated.


Subscribe to our newsletter and get the latest insights that help you stay ahead of the curve.

© 2017-2025 All rights are reserved


